What is Vitals?
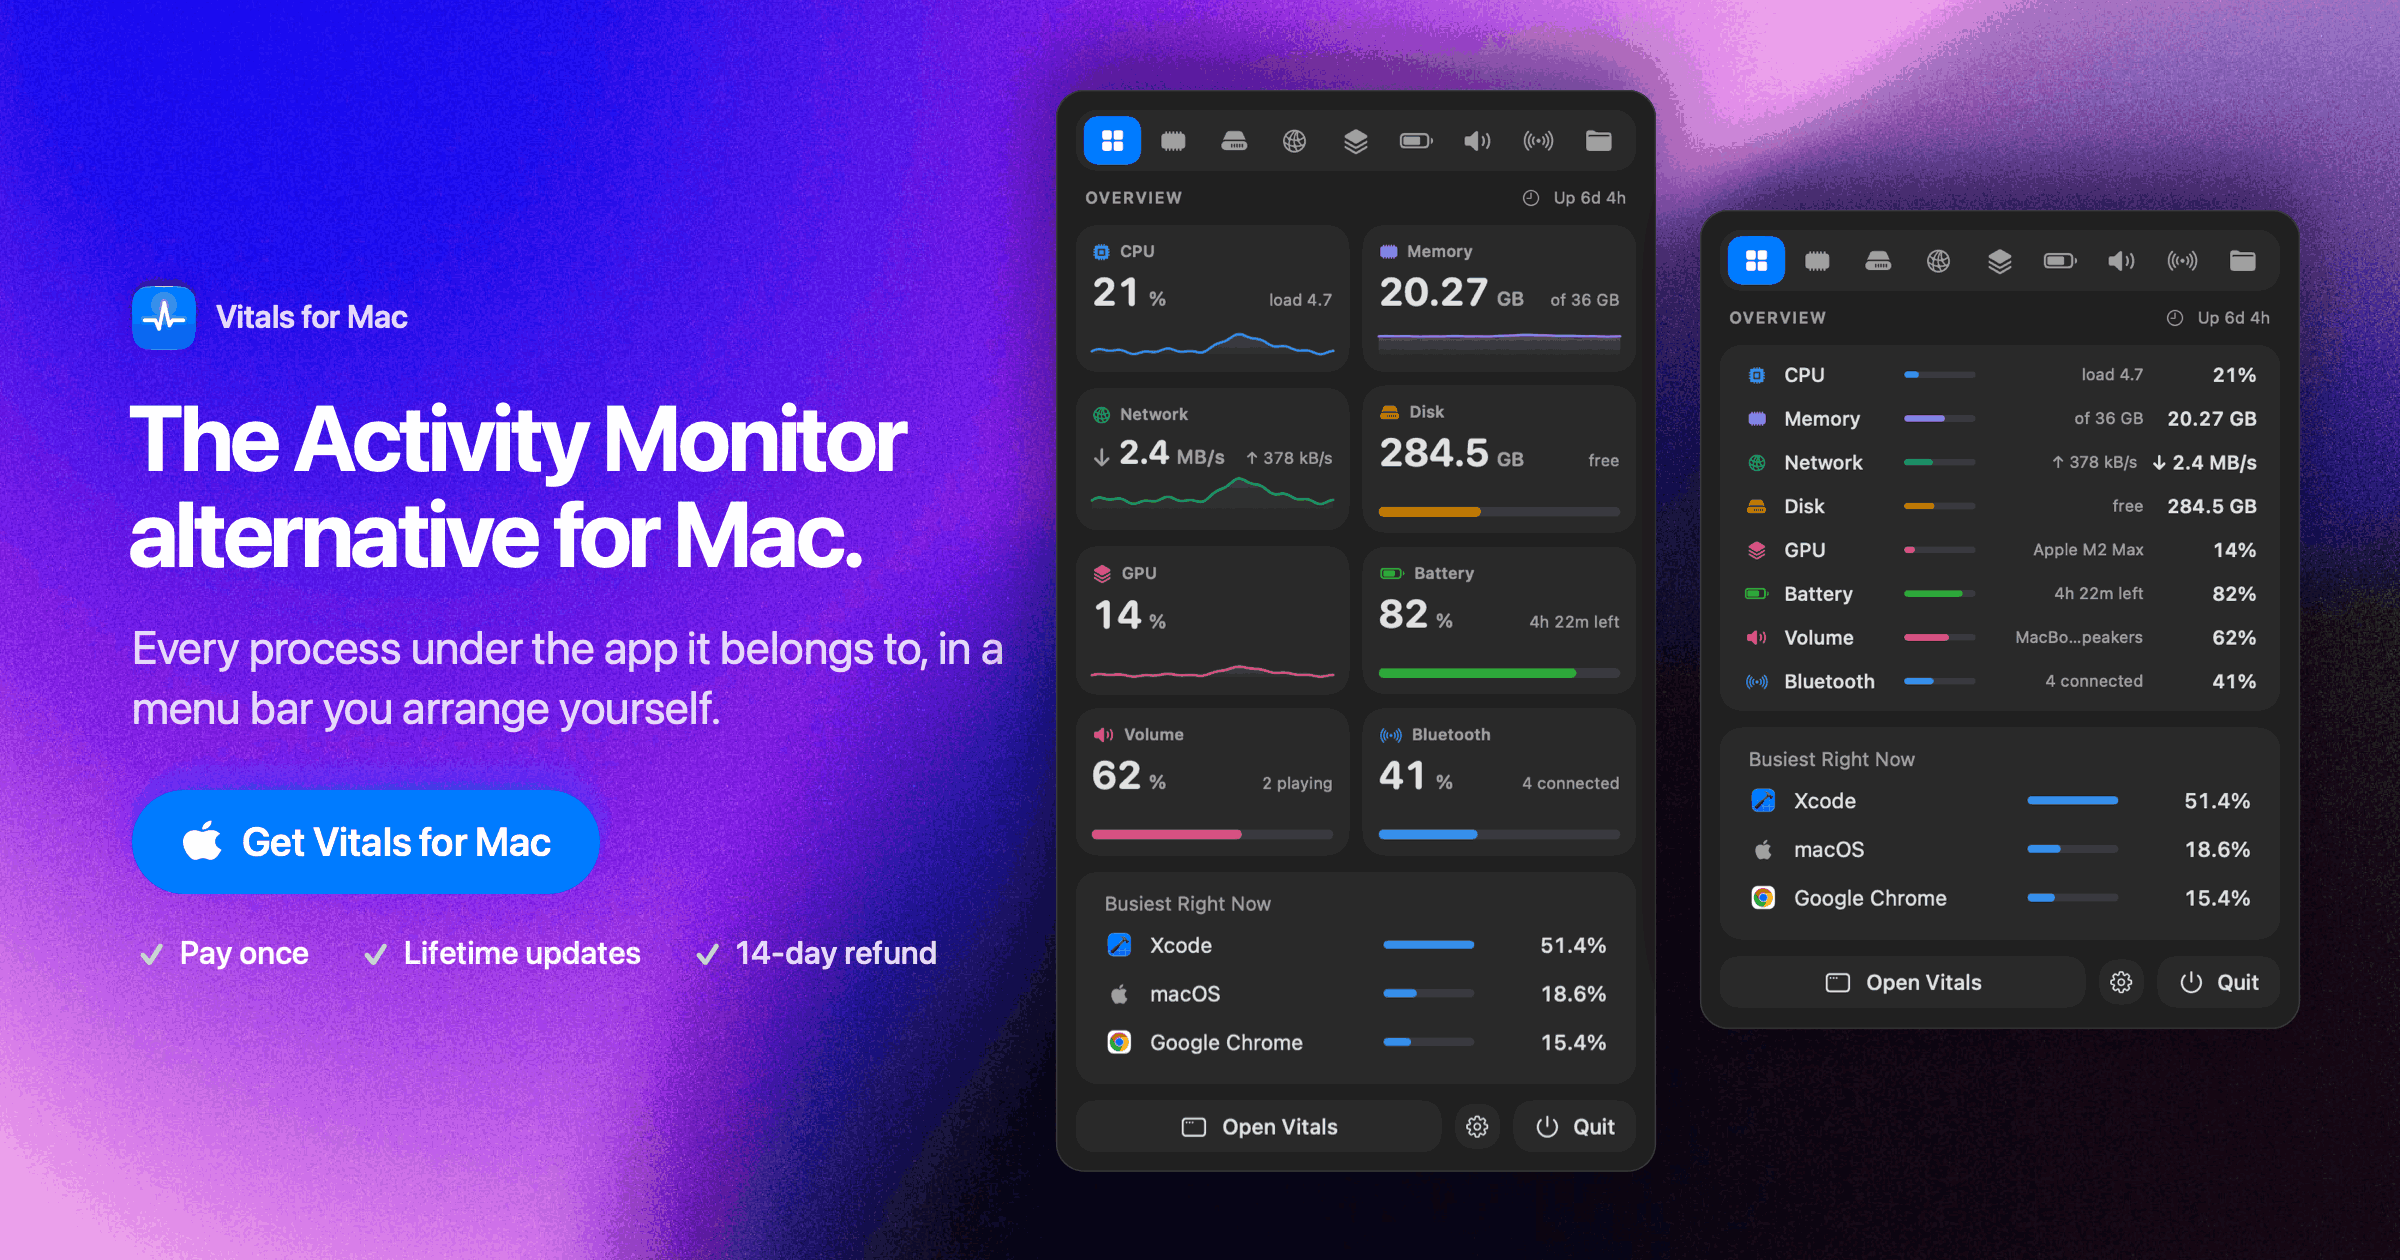
Vitals is a Mac system monitor for people who want to know which app is actually behind a CPU, memory, disk, network, GPU, or battery problem. It groups helper processes under the app that launched them, keeps 30 days of per app history, and can surface the busiest apps from the menu bar. It runs on macOS 15 Sequoia or later on Apple silicon and Intel Macs.
Why Vitals works
Activity Monitor can turn a simple question like what is eating memory into a list of about a thousand processes that you have to add up yourself. Vitals groups those helpers into one app level figure, keeps the history, and flags sustained CPU, memory, disk, or network spikes, so you see the app causing the problem instead of decoding process names.
Vitals features
- See resource use by app. Helper processes are rolled into the app that launched them, giving one figure per app for memory, CPU, energy, disk, and network instead of separate rows for every process.
- Keep 30 days of history. Review the last 12 hours, 24 hours, 7 days, or 30 days for each metric and see which apps used the most resources during that period.
- Catch apps that start misbehaving. Vitals can notify you when an app hogs CPU, keeps growing in memory, or drives heavy disk or network activity.
- Monitor from the menu bar. CPU, memory, GPU, network, disk, temperature, and battery can each appear as a value, graph, or both, and can be rearranged in the menu bar.
- Find idle development servers. Processes are grouped by project folder with their open ports, and Vitals points out idle development servers before offering to stop them.
- Keep activity data on the Mac. Apps, history, and project names stay on the Mac. Vitals uses network requests only to check for updates and validate the license.
Who Vitals is for
- Mac users troubleshooting slowdowns who want to see which app is behind a CPU, memory, disk, or network spike without reading hundreds of process names.
- Developers running local projects who want idle dev servers, open ports, and memory use grouped by project instead of hunting through terminal processes.
- People who keep system metrics in the menu bar and want the current load plus the apps responsible for it in the same view.
- Mac users who want longer term resource history so they can investigate what happened while they were not watching the machine.
Similar micro SaaS ideas you can build
- AI feature cost mapper. A tool for small SaaS teams that groups model calls and token spend under the product feature that triggered them, keeps usage history, and flags sudden cost or latency spikes before the raw API logs become a debugging exercise.
- Home energy culprit tracker. A household energy monitor that rolls smart plug and circuit readings up to individual appliances, keeps daily history, and warns when a fridge, heater, or other device starts drawing far more power than its normal baseline.
- Background job owner map. A monitoring tool for small engineering teams that links queues, scheduled jobs, and workers back to the customer workflow or product feature they serve, then surfaces the owner of a CPU, memory, or failure spike instead of leaving engineers to trace infrastructure names by hand.