What is ChartQuery?
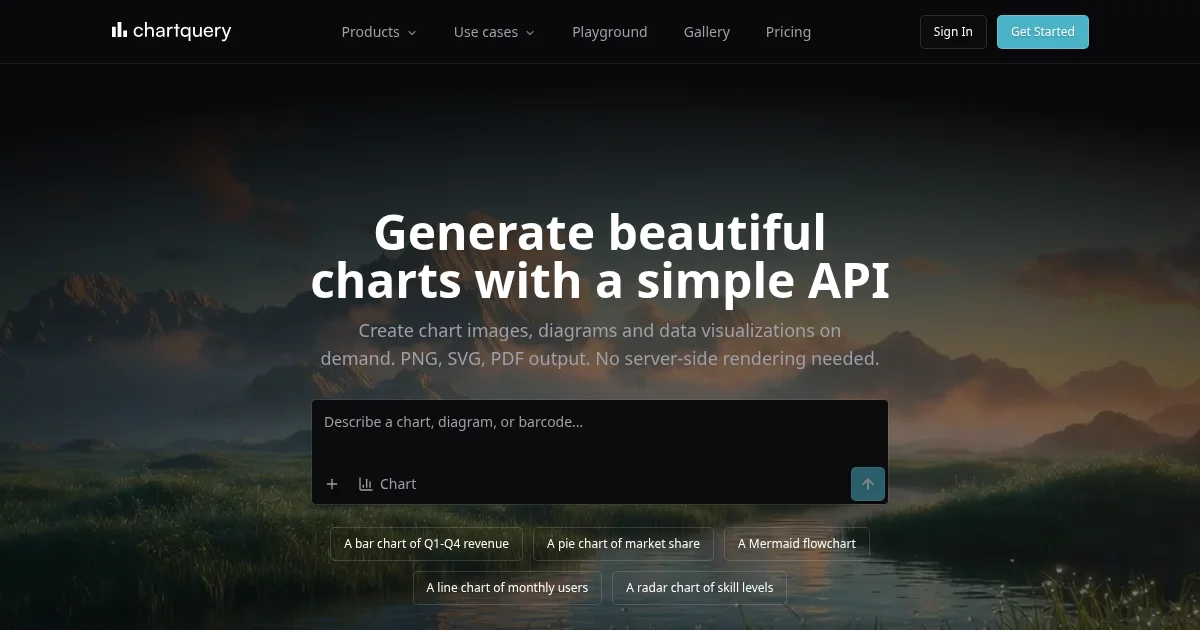
ChartQuery is a REST API that generates chart images, diagrams, barcodes, QR codes, and labels on demand, returning PNG, SVG, JPEG, or PDF output from a single API call with no rendering infrastructure required on the caller's side. It covers 10 chart types and 28 diagram languages including Mermaid, PlantUML, GraphViz, and D2, all available under one API key. Developers send a JSON config or describe a chart in plain English using the AI Generate endpoint, and the API returns a rendered image in under 500ms on average.
Why ChartQuery works
Backend services that need chart or diagram images have traditionally required a headless browser, a Node.js canvas, or a dedicated rendering service, adding infrastructure complexity and latency to every image generation step. ChartQuery moves that entire stack to a hosted API: a single POST with a JSON config or a plain-English description returns a finished image, with no Puppeteer instance to maintain, no scaling to manage, and no rendering layer to debug.
ChartQuery features
- Chart Image API. Renders 10 chart types including bar, line, pie, radar, and scatter from a JSON config into PNG, SVG, JPEG, or PDF, so backends and reporting pipelines get finished chart images without maintaining a rendering server.
- Diagram Rendering. Converts 28 diagram languages including Mermaid, PlantUML, GraphViz, and D2 into vector images via a single endpoint, so engineering and documentation teams can automate diagram generation in CI pipelines.
- AI Chart Generation. Accepts a plain-English description and raw data, configures the chart automatically, and returns a rendered image, so teams can generate visualizations without writing or debugging JSON configs.
- Barcode and QR Code API. Generates Code128, EAN-13, and UPC-A barcodes and customizable QR codes on demand, so e-commerce and logistics applications can produce scannable assets without a separate barcode library.
- Shipping Label API. Renders formatted shipping label images on demand alongside the barcode and QR code endpoints, so fulfillment workflows can generate all label assets through the same unified key and billing account.
- Unified API Key. All five endpoints (charts, diagrams, AI generation, barcodes, and labels) share one API key and one billing account, so teams integrate multiple visualization types without managing separate credentials or rate-limit quotas.
Who ChartQuery is for
- Backend developers who need chart or diagram images in their applications can call a single REST endpoint instead of spinning up a headless browser or a rendering service.
- SaaS teams generating PDF reports or email digests can add charts to their output by calling the API at render time, keeping the pipeline serverless without a separate charting stack.
- No-code and low-code builders who need chart images in automated workflows can embed a URL call into tools like Zapier or n8n without writing any rendering code.
- DevOps and documentation teams automating diagram generation can pass Mermaid, PlantUML, or GraphViz source through CI pipelines and receive rendered SVG or PNG output without a local rendering tool.
Similar micro SaaS ideas you can build
- Dynamic Open Graph Image API. Indie developers and content platforms, generates chart-based social sharing images from live data at request time, replacing static placeholder images; they pay per generation.
- Automated Schema Diagram Service. Dev teams using database or API versioning tools, converts schema diffs or spec changes into visual diagram images and appends them to pull requests or changelogs automatically; they pay per render run to skip manual diagramming.
- White-Label PDF Report API. Agencies and analytics tools, assembles chart images from client data into formatted PDF reports on a schedule; clients pay a per-report fee to avoid maintaining a charting and PDF rendering stack themselves.